Three Ways to Visualize the Start of a Potential Distribution Phase
Method 1: Volume Analysis
Volume analysis is a critical tool in identifying the beginning stages of a potential distribution phase. By closely examining the trading volume accompanying price movements, traders can gain valuable insights into market sentiment. In the early stages of distribution, monitoring trading volume can help uncover any irregularities or patterns that may indicate a shift in momentum. An increase in volume coupled with a lack of significant price movement could be a sign that accumulation is transitioning into distribution. Conversely, a decrease in volume following a prolonged uptrend may suggest that market participants are losing interest in buying, signaling a potential distribution phase.
Method 2: Support and Resistance Levels
Another effective way to visualize the start of a potential distribution phase is by analyzing support and resistance levels on a price chart. Support levels represent areas where a security’s price has historically found buying interest, preventing it from declining further. Conversely, resistance levels indicate points where selling pressure has halted upward movements. When a stock approaches a significant resistance level and struggles to break through it despite multiple attempts, this could indicate that distribution is beginning to take place. Similarly, a break below a key support level accompanied by increasing selling volume may signal the start of a distribution phase as investors start to offload their positions.
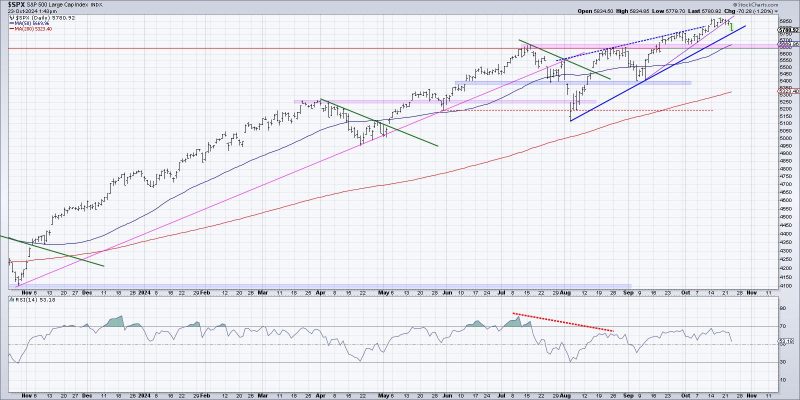
Method 3: Moving Averages and Trendlines
Utilizing moving averages and trendlines can also help traders visualize the onset of a potential distribution phase. Moving averages are useful for smoothing out price fluctuations and identifying trends over a specific period. When a stock’s price begins to trade below its moving averages or breaks through a long-term trendline, this could indicate a shift in market dynamics from accumulation to distribution. Additionally, observing the interaction between different moving averages, such as a bearish cross between the 50-day and 200-day moving averages, may further confirm the start of a distribution phase. By paying close attention to these technical indicators, traders can stay ahead of potential market reversals and adjust their trading strategies accordingly.
In conclusion, visualizing the start of a potential distribution phase requires a combination of technical analysis tools and a keen understanding of market dynamics. By employing methods such as volume analysis, support and resistance levels, as well as moving averages and trendlines, traders can better identify early warning signs of distribution and protect their portfolios from potential losses. Keeping a watchful eye on these visual cues can help traders navigate changing market conditions and make informed decisions to stay ahead of the curve.