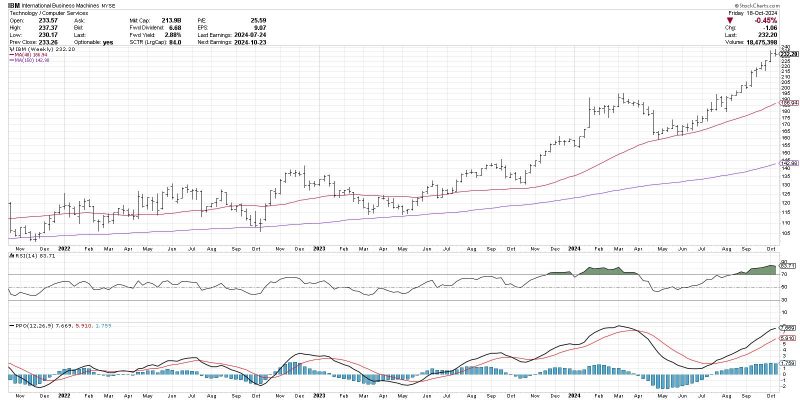
The MACD Histogram: A Powerful Tool for Anticipating Trend Changes
Understanding market trends and accurately predicting their potential reversals are key skills for successful traders and investors. Various technical indicators are available for this purpose, with the Moving Average Convergence Divergence (MACD) being one of the most popular and reliable indicators. Over the years, traders have commonly used the MACD Histogram, which is derived from the MACD indicator, to help anticipate trend changes in financial markets.
The MACD Histogram is a valuable tool that provides crucial insights into the momentum and direction of a market trend. By analyzing the relationship between two moving averages in the MACD indicator, traders can identify potential shifts in market sentiment and make informed trading decisions. The histogram visually represents the difference between the MACD line and the Signal line, offering a clear depiction of the strength and momentum of a trend.
One of the primary advantages of using the MACD Histogram is its ability to signal potential trend changes ahead of time. When the histogram crosses above the zero line, it indicates that the bullish momentum is strengthening, suggesting a potential uptrend in the market. Conversely, a crossover below the zero line signifies a build-up of bearish momentum, signaling a possible downtrend. Traders can use these crossover signals to enter or exit trades at favorable positions, maximizing their profit potential.
Moreover, the MACD Histogram can also provide valuable insights into the momentum of a trend. Divergences between the price action and the MACD Histogram can indicate weakening trends or potential reversals. For instance, if the price reaches a new high while the MACD Histogram fails to confirm the upward momentum, it could be a warning sign of an imminent trend reversal. By recognizing these divergences early on, traders can avoid potential losses and adjust their trading strategies accordingly.
Another key benefit of the MACD Histogram is its simplicity and ease of interpretation. Traders of all levels can easily understand and incorporate this indicator into their analysis, making it a versatile tool for identifying trend changes across various financial instruments and timeframes. By combining the insights provided by the MACD Histogram with other technical analysis tools, traders can enhance their overall trading strategy and increase their chances of success in the markets.
In conclusion, the MACD Histogram is a powerful and reliable tool for anticipating trend changes in financial markets. Its ability to provide early signals of potential reversals, detect momentum shifts, and offer simplicity in interpretation makes it a valuable asset for traders looking to enhance their trading performance. By incorporating the MACD Histogram into their analysis, traders can gain a competitive edge in identifying profitable trading opportunities and navigating market trends with confidence.


