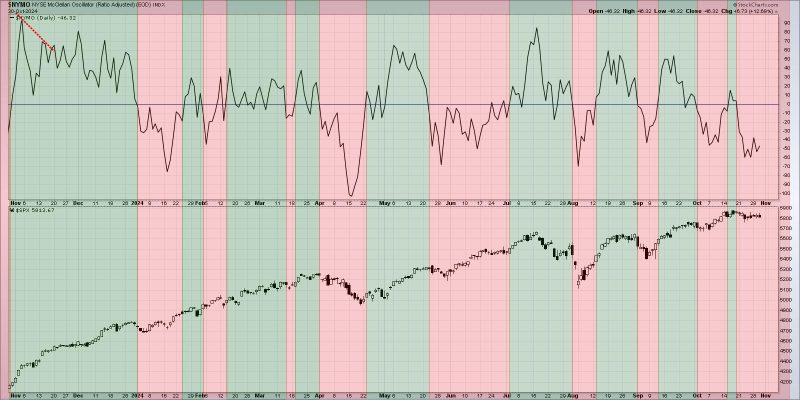
In the world of financial markets, traders and analysts alike often turn to technical indicators to gauge the strength and direction of market trends. One such indicator that has garnered significant attention in recent weeks is breadth divergences. These divergences, which occur when the number of stocks trading above their moving averages diverges from the overall market trend, can serve as a powerful signal of potential shifts in market sentiment.
The concept of breadth divergences is based on the idea that a healthy market rally should be supported by a broad participation of individual stocks. In other words, as the major stock indices rise, a majority of stocks should also be trending upwards. When this is not the case, and fewer stocks are participating in the rally, it can signal underlying weakness in the market.
One common breadth indicator used by analysts is the Advance-Decline Line (AD Line). This indicator tracks the difference between the number of advancing and declining stocks on a given day. A rising AD Line indicates broad market strength, while a declining line suggests deteriorating market breadth.
Another widely followed breadth indicator is the percentage of stocks trading above their 200-day moving average. This metric provides insight into the overall health of individual stocks within an index. When a large percentage of stocks are trading above their long-term moving average, it indicates that the market is in a healthy, uptrend. Conversely, a decreasing number of stocks trading above this key level can suggest weakening market momentum.
Recently, market observers have noted significant breadth divergences in the current market rally. While major indices like the S&P 500 and Dow Jones Industrial Average have been hitting new all-time highs, the proportion of stocks participating in the rally has been shrinking. This divergence has raised concerns among some analysts that the market may be vulnerable to a potential correction.
It is worth noting that breadth divergences alone are not foolproof indicators of an impending market downturn. Market dynamics are complex and multifaceted, and a variety of factors can influence the direction of stock prices. However, breadth indicators can serve as valuable tools for investors to assess the overall health of the market and make informed decisions about their investment strategies.
As always, it is essential for investors to conduct thorough research and analysis before making any investment decisions. While breadth divergences may hint at potential shifts in market sentiment, they should be used in conjunction with other technical and fundamental indicators to form a holistic view of the market environment.
In conclusion, breadth divergences can offer valuable insights into the underlying strength or weakness of a market rally. By monitoring indicators like the Advance-Decline Line and the percentage of stocks above their moving averages, investors can better assess the breadth of market participation and make more informed investment decisions. While breadth divergences are not infallible predictors of market movements, they can provide important signals that should be taken into consideration alongside other critical factors.


